
I’ve been building presentation templates for a long time, and I do admit that I’ve certainly got a style that I tend to gravitate towards. Most of my slides are very basic with few dynamic elements (it’s rare that I build 3d shapes in PowerPoint), but I’ve recently started to realize how easy it is to create nice looking 3d charts and graphs that are fully editable and completely dynamic (like this widescreen Facebook template with editable circle graphs).
Ok – I know that I’m stubborn, but I haven’t experimented much due to the fact that creating these templates is not something that I have a true passion for. Of course I enjoy the design process, but I’ll be honest when I say that I’d rather not spend my valuable free time tinkering with PowerPoint trying to push the limits of what it is capable of!
How easy is it to create 3d shapes in PowerPoint?
The good news is that I’ve been feeling especially creative recently, so I decided to see what kind of basic 3d charts and graphs I could make right in PowerPoint. I didn’t have any particular goal in mind, other than trying to create some fully editable and dynamic 3d objects that can be used in a variety of ways.
As shocking as it may sound, the 3d tools in PowerPoint are actually quite powerful. Any object (shape or text) can be converted to 3d and rendered in any angle you’d like. The perspective angle, lighting angle, and material settings are all attributes that can be modified, though it is a bit disappointing that light intensity cannot be changed. It seems to me that would be a simple thing to add, so let’s cross our fingers that it is included with future versions of PowerPoint.
Here’s a screenshot of the charts and graphs I was able to create in just a few short hours. Clicking on the image will take you directly to the source file, btw.
Anyway, on with the slides
Note that the height/depth of each chart segment is completely editable, and you can make adjustments by double-clicking on the element you want to change. Once selected, right click on it and select “Format Shape…”. Then select “3-D Format” from the menu in the popup window, and then select the “Depth & Surface” tab. There you will see the “Depth” setting, which you can change to whatever you want. Note that changing the height might move the segment up or down so that it isn’t sitting on the same plane as the other objects. No worries – just navigate to the “3-D Rotation” menu item in the left menu and adjust the “Distance from center” option to move it back where you want it to be.
Editable 3d charts and graphs PowerPoint template slide example.
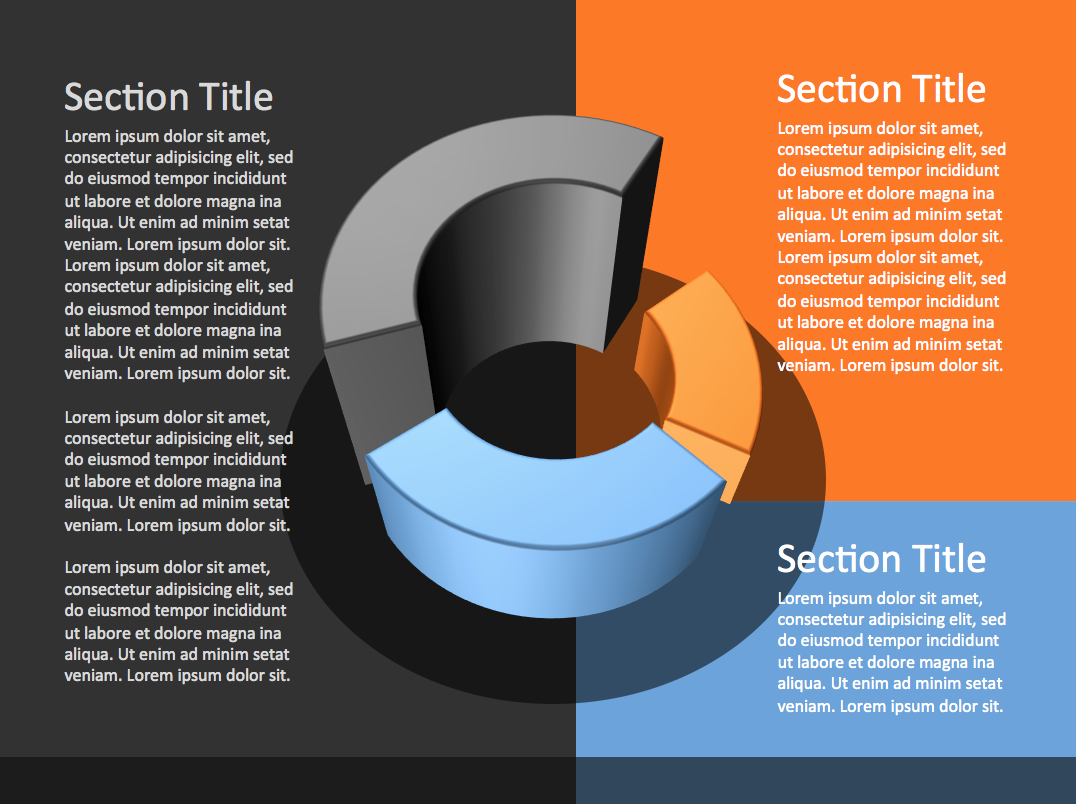
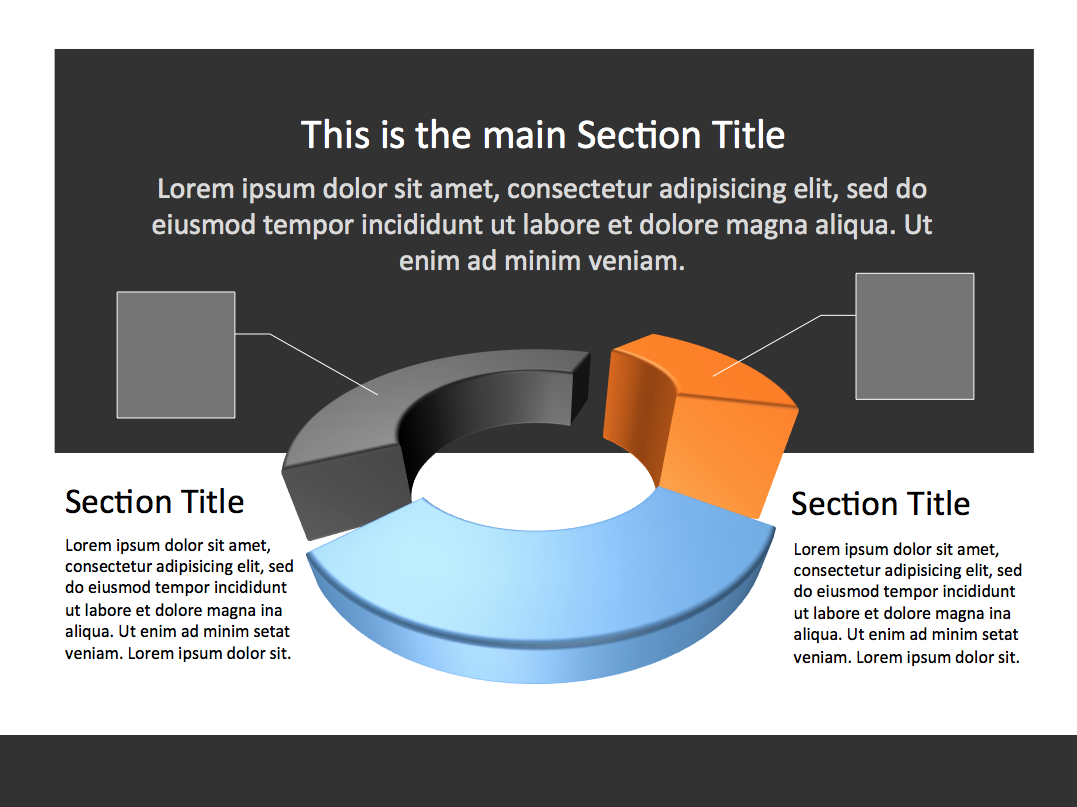
This particular slide shows a simple three-segment circle graph from a top-down angle, with background colors that match the colors of the graph.
Editable 3d shapes PowerPoint template slide example.
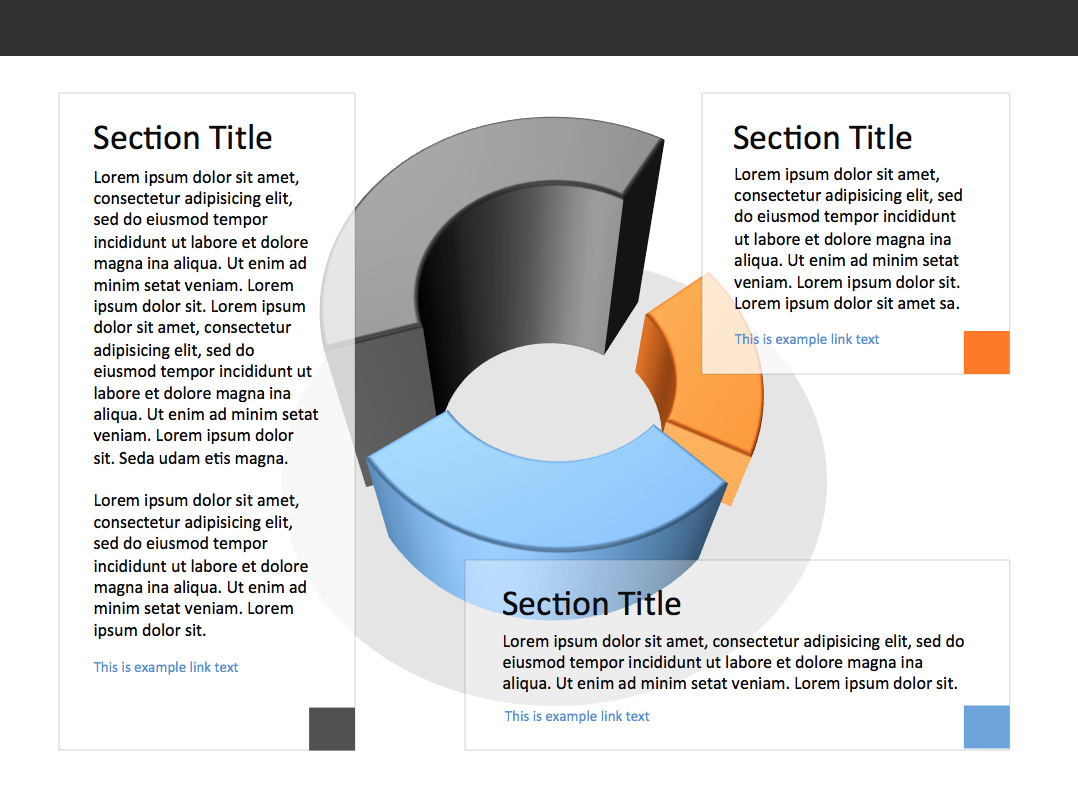
Thinking that the first slide was a bit too heavy (visually), I placed the same circle graph over a white background to help make the slide look much lighter. I then placed transparent white content blocks over each section as a place to add description text.
Editable 3d charts and graphs PowerPoint template slide example.
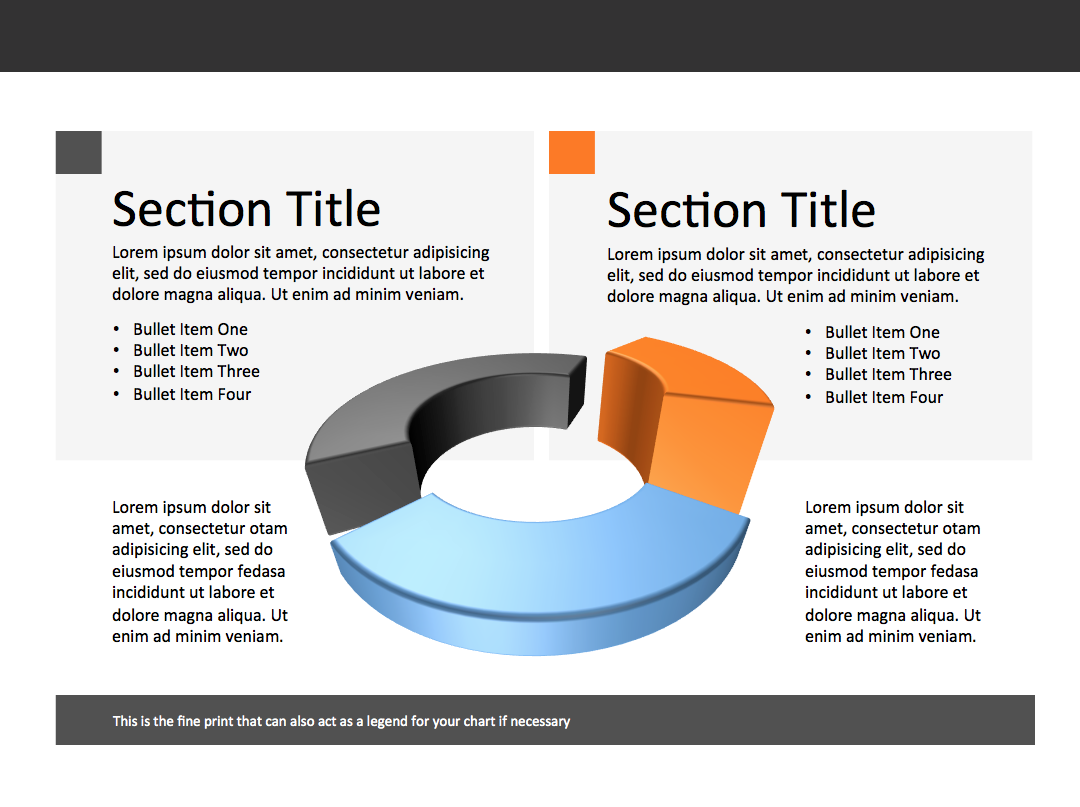
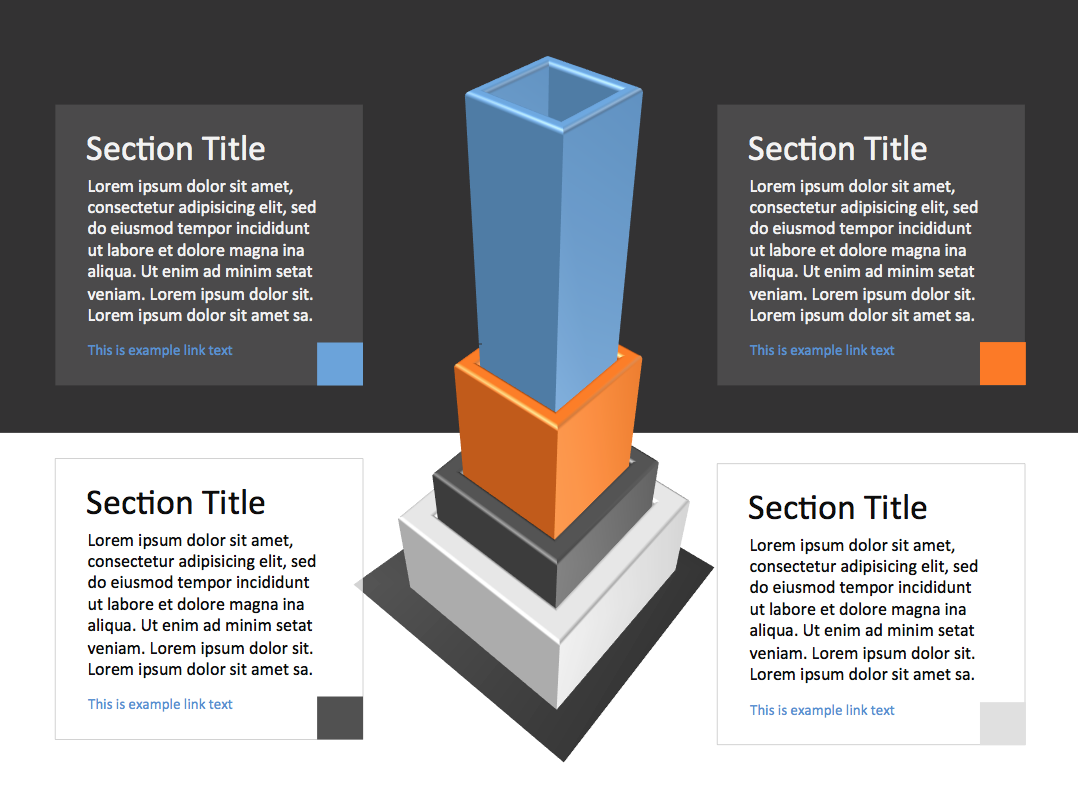
The nice thing about PowerPoint’s 3d rendering tool is that you can adjust the perspective angle. This slide features that same three-segment circle graph at a much more extreme angle over transparent gray content blocks.
Editable 3d charts and graphs PowerPoint template slide example.
Slide number 4 is a variation of the third, with a dark gray content block for the top section.
Editable 3d charts and graphs PowerPoint template slide example.
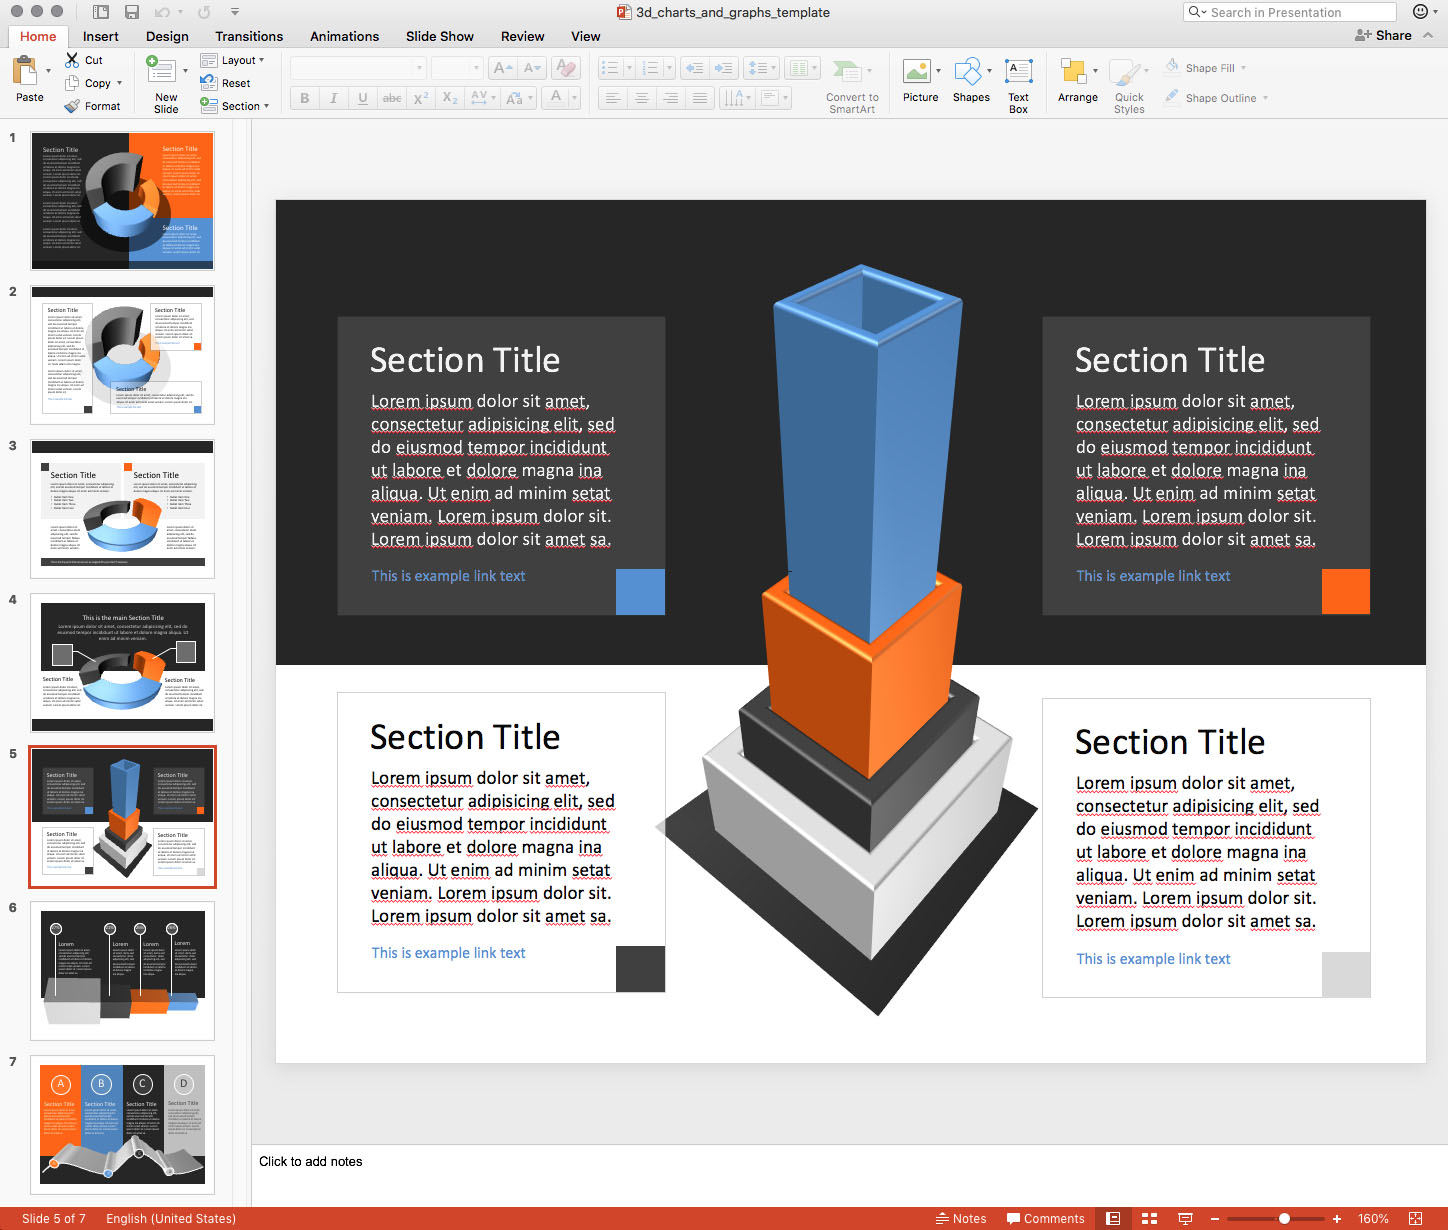
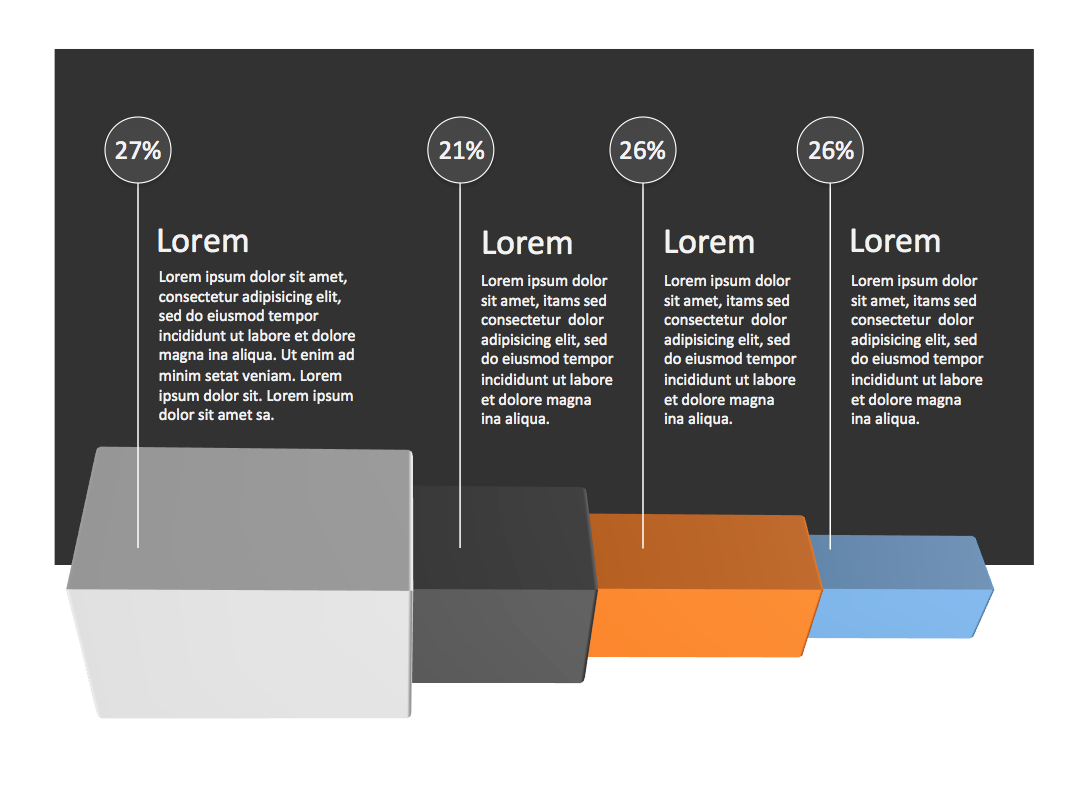
Column graphs are also popular (and easy) 3d PowerPoint shapes, and here’s an example of one that I created showing four different data column that fit inside of each other. The extreme perspective makes for a visually powerful slide.
Editable 3d charts and graphs PowerPoint template slide example.
Laying the 3d column graph on it’s side is another way of presenting data. This is where PowerPoint’s 3d lighting tool falls short, however. I would have much preferred to light this graph from the top, but doing so made the front face too dark. Having a multiple-light option would be a great help here.
Editable 3d charts and graphs PowerPoint template slide example.
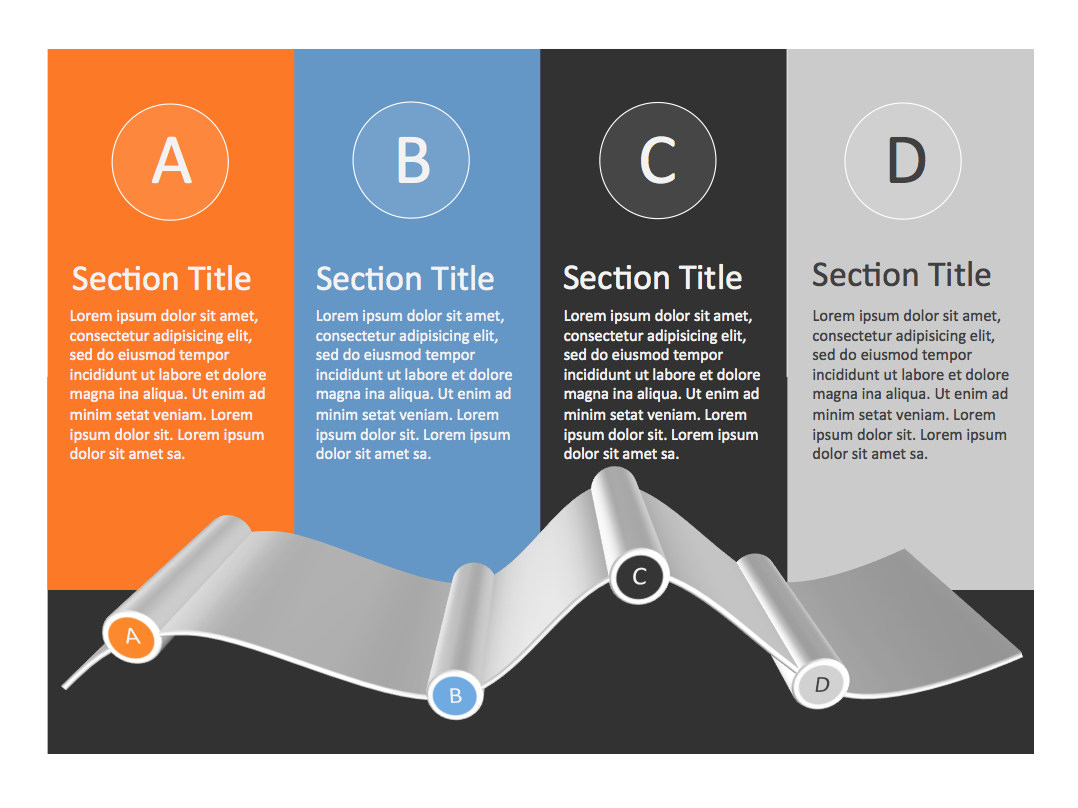
It’s also possible to create free-form 3d graphs directly within PowerPoint. I created the one above by drawing a simple wavy curve, placing circle points on it, grouping everything together, and then converting to 3d. I probably could have created something that looks much nicer, but as I said at the top of this post, spending too much time in PowerPoint is not something I strive for on a daily basis.
So there you have it. I’ll try to create more of these simple 3d shapes for PowerPoint from this point forward, and I’ll also make sure to include some of them in any themed template that I create as well.
Want the source files for these PPT slides? Clicking on the button below will take you directly there:


No Responses Yet